Methanemissionen machen Gas umweltschädlicher als Kohle


Die Lüge über Gas – und wie sie unser Energiesystem prägt
Die Umstellung von Kohle und Öl auf Gas zur Versorgung von Heizungen und energieintensiven Prozessen wurde als großartige Initiative zur Senkung der CO₂-Emissionen angesehen. Die Annahme, dass Gas sauberer ist als andere fossile Brennstoffe, basiert auf der Endnutzung – der Verbrennung. Wenn nur dies berücksichtigt wird, „emittiert Gas nur halb so viel CO₂ wie Kohle“ (Gordon et al. 2023).
Und das ist nichts anderes als eine Beschönigung der Zahlen oder eine Lüge über die tatsächlichen Auswirkungen. Denn Tatsache ist, dass Erdgas (Methan) große Leckagen aufweist. Es entweicht bei der Förderung, bei der Verteilung und bei der Verarbeitung. Und das entweichende Methan ist 80-mal schädlicher als das Kohlendioxid, das über einen Zeitraum von 20 Jahren in die Atmosphäre gelangt, und fast 30-mal schädlicher über einen Zeitraum von 100 Jahren.
„Wir unterschätzen definitiv den Beitrag von Erdgas zur globalen Erwärmung im Vergleich zu Kohle“, sagt Desirée Plata, Associate Professorin für Bau- und Umweltingenieurwesen und Direktorin des MIT Methane Network. Ihrer Meinung nach werden Leckagen nicht richtig berücksichtigt, wodurch Erdgas in einer schlechteren Klimaposition als Kohle steht (MIT Climate).
Methan entweicht, wenn es an die Oberfläche gebracht wird. Auf den Feldern baut Methan Druck in den Leitungen auf. Dann entweicht es durch defekte Ventile und sogar durch fehlerhafte Schweißnähte. Und das nicht nur am Produktionsort. Es geschieht auch in Pipelines, Speicher- und Verteilungsnetzen.
Und diese Lecks sind, wie Studien der letzten Jahre gezeigt haben, dramatischer als bisher angenommen. Damit Gas besser als Kohle ist, dürfen Methanlecks laut Studien nicht zu groß sein. Bei Kohlebergwerken, die selbst nur sehr geringe Methanlecks aufweisen, liegt der Wert bei nur 1,8 %.
Wie viel Methan entweicht?
Methanlecks können mit Satelliten gemessen werden, die die Wellenlänge des Lichts überwachen. Methan ist nicht sichtbar, absorbiert jedoch bestimmte Wellenlängen des Sonnenlichts. Satelliten können daher größere Lecks erkennen, insbesondere in Öl- und Gasfeldern. Für kleinere Lecks gibt es spezielle Kameras, die Infrarottechnologie verwenden. Dazu gehören optische Gasbildkameras und Hyperspektralkameras. Während letztere schwer zu skalieren sind, liefern erstere ein klares Bild, insbesondere in Kombination mit Satelliten.
Und hier betrachten wir die USA, wo die Förderung fossiler Brennstoffe enorm zugenommen hat. Während die US-Umweltbehörde EPA den Umfang der Methanemissionen aus Leckagen nicht veröffentlicht, zeigen Forscher, dass diese zwischen 2010 und 2019 massiv zugenommen haben (siehe Lu et al. 2023).
Die Forschungsgruppe kommt zu dem Schluss: „Wir stellen eine erhebliche Unterschätzung der nationalen Bestandsaufnahmen der Öl-/Gas-Methanemissionen von 2010 bis 2019 in ganz Nordamerika fest, insbesondere im mittleren Süden und Mittleren Westen der USA, in Alberta und Saskatchewan in Kanada sowie im Onshore-Ölfeld Sureste in Mexiko.“ Die Emissionen der US-Standorte lagen um 70 % über den Angaben in ihrem nationalen Bericht, die Emissionen Kanadas um 67 % und die Mexikos um 50 % über den Angaben in ihren jeweiligen nationalen Berichten.

Während die EPA schätzt, dass zwischen 1 % und 1,4 % des geförderten Erdgases entweichen, haben Studien erschreckende Zahlen ergeben. Im Permian Basin in Texas und New Mexico entweichen 3,7 % (Zhang et al. 2020). In einer Studie, die sich auf New Mexico in den USA stützt, wurden Leckagen von bis zu 9 % der Produktion festgestellt (Chen et al. 2022), und im Vereinigten Königreich schätzen die Forscherin Catherine Mitchell und ihre Kollegen, dass die Leckagen in den Verteilungsleitungen 1990 zwischen 5,9 % und 10,8 % lagen. Ob sich dies in der britischen Infrastruktur geändert hat, ist fraglich.
Eine Studie hat ergeben, dass ein Methanleck von 0,2 % aus der Gasproduktion bei Einbeziehung der Schwefeldioxid- (SO₂)-Emissionen mit methanarmen Kohlebergwerken gleichgesetzt werden kann. Dies gilt für das globale Erwärmungspotenzial (GWP20) über 20 Jahre. Dieser Zeitrahmen ist wichtig, um Kipppunkte im Klimasystem zu vermeiden (siehe Gordon et al., 2023). Mit einer Leckagerate von 2 % könnte Erdgas laut Gordon et al. mit Kohle und deren Methanemissionen, wie sie vom IPCC ermittelt wurden, gleichauf liegen. Wie Sherwin et al. zeigen, deuten US-Satellitendaten auf eine Leckagerate von 2,95 % für Öl- und Gasfelder hin (2024).
Wenn dies in Amerika der Fall ist, dann werden Produktionsanlagen in Russland, Turkmenistan oder Iran – wo es schwierig ist, an Daten zu gelangen – vergleichbare, wenn nicht sogar größere Leckagen aufweisen.

Die Mindestleckrate für diese Grafik betrug eine Tonne pro Stunde. Darin nicht enthalten sind beispielsweise Leckagen in Verteilungsleitungen, die überall auftreten, auch in Europa.
Kleinere Lecks in Verteilungsnetzen
Darüber hinaus sind insbesondere kleinere Lecks schwer zu erkennen und zu quantifizieren. Von Rohren mit undichten Schweißnähten bis hin zu Kompressionsanlagen und -stationen – Lecks gibt es überall. Menschen wie die Methan-Tracker der Clean Air Task Force sowie Einzelpersonen haben immer wieder auf regionale Lecks hingewiesen. Die CATF veröffentlichte einen Bericht, der 289 undokumentierte Methanemissionen aufzeigt – von 430 besuchten Standorten in ganz Europa. Das bedeutet, dass zwei von drei Öl- und Gasanlagen Methan verlieren.
Lecks traten besonders häufig in Lagertanks, Entlüftungsöffnungen und ungezündeten Fackeln auf. Darüber hinaus wurden Pipelines an Anlagen wie Bohrlöchern, Verarbeitungsstationen und Druckentlastungsstationen als eine wichtige Quelle für kleine Lecks identifiziert. Da diese kleinen Lecks nicht sehr gut quantifizierbar sind, könnte das Problem der Leckagen und damit der Methanemissionen sogar noch größer sein. Mit einer realistischen Zahl von 2,8 % der vorgelagerten Emissionen und zusätzlichen nachgewiesenen nachgelagerten Emissionen entspricht das ausgetretene Methan in etwa den Emissionen von Kohle.
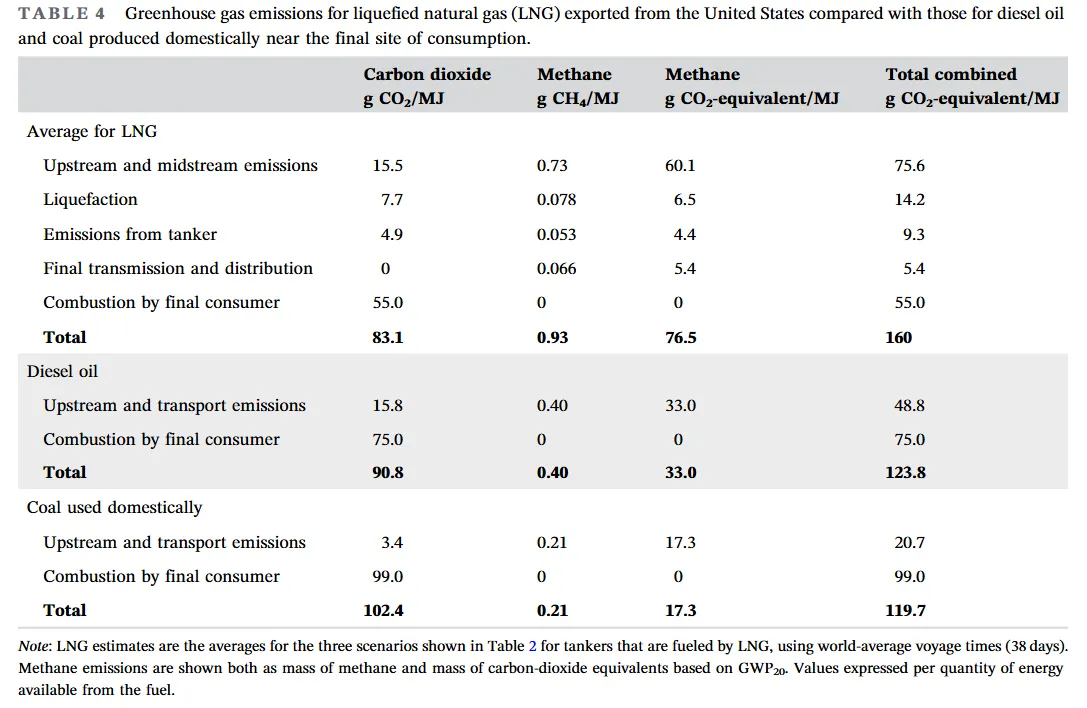
LNG – das umweltschädlichste Produkt
Bei LNG gibt es nicht nur Leckagen bei der Produktion und Verteilung, sondern auch erhebliche Leckagen und emissionsintensiven Energieeinsatz bei der Verarbeitung sowie ineffizienten Transport fossiler Brennstoffe. Diese zusätzlichen Quellen von Treibhausgasen, sowohl CO₂ als auch Methan, entstehen durch Verflüssigung, Methanleckagen bei der Verteilung an den Tanker, Verbrennung von LNG oder Diesel im Tanker und schließlich durch den Transport und die Verteilung vom Hafen zum Endverbraucher (vgl. Howarth, 2024, S. 4852). Das unterstreicht die Bedeutung von Methanemissionen bei der LNG-Produktion und -Verteilung und zeigt, dass schon geringe Leckagen ausreichen können, um die Emissionsvorteile gegenüber Kohle zunichtezumachen. Schon im mittleren, nicht erst im oberen Bereich möglicher Methanlecks ist LNG deutlich klimaschädlicher als Kohle und Diesel.

Die vollständige Ökobilanz von Howarth zeigt detailliert, wie die Methanemissionen die Kohlenstoffemissionen von Kohle überwiegen.
Zusammenfassung
Methanemissionen sind ein Treiber des Klimawandels, und es hat sich wiederholt gezeigt, dass die Leckagen weitaus höher sind als angegeben. Gas kann aufgrund der zahlreichen Leckagen bei der Förderung, dem Transport und der Speicherung durchaus umweltschädlicher sein als Kohle. Liegen die Leckagen im nachgewiesenen Durchschnitt, verursacht LNG mehr Emissionen als Kohle.
Das bedeutet, dass Messungen durchgeführt werden müssen. Die Überwachung und Reparatur von Leckagen wäre wirtschaftlich rentabel, da dadurch das Fördervolumen gesteigert würde. Die Verbraucher in Europa haben jedoch keinen Einfluss auf die Reparatur massiver Leckagen aus Öl- und Gasbohrungen. Es müssen rasch Maßnahmen ergriffen werden, um Leckagen zu stoppen.
Darüber hinaus müssen neue Gasherde und Heizsysteme in Haushalten verboten werden, um den Bedarf an LNG zu reduzieren. Die Industrie muss elektrifiziert werden, und neue Gaskessel sollten vermieden werden. Es müssen Anreize für die Elektrifizierung geschaffen werden. Europa muss so unabhängig wie möglich von Gas werden. Leckagen in der chemischen Industrie, die Methan als Rohstoff verwendet, müssen berücksichtigt werden. Außerdem muss die direkte Reduktion mit Gas in der Stahlindustrie und eine Lebenszyklusanalyse im Vergleich zu Kohle überdacht werden.
Dies stellt auch die Idee von Gaskraftwerken ernsthaft in Frage. Das bekannte Potenzial zur Absicherung von Energiesystemen durch Langzeitspeicher – von Pumpspeichern, mechanischen Energiespeichern und thermischen Energiespeichern mit bestehenden Kraftwerken – muss vorangetrieben und stärker berücksichtigt werden, da Europa die Leckagen und damit die Emissionen nicht kontrollieren kann.
Quellen
Andreas Forstmaier, Jia Chen, Florian Dietrich, Juan Bettinelli, Hossein Maazallahi, Carsten Schneider, Dominik Winkler, Xinxu Zhao, Taylor Jones, Carina van der Veen, Norman Wildmann, Moritz Makowski, Aydin Uzun, Friedrich Klappenbach, Hugo Denier van der Gon, Stefan Schwietzke, & Thomas Röckmann. (2022). Quantification of methane emissions in Hamburg using a network of FTIR spectrometers and an inverse modeling approach. Atmospheric Chemistry and Physics, 23(12). https://doi.org/10.5194/acp-23-6897-2023
Benjamin Storrow & E&E News. (2020). Methane leaks erase some of the climate benefits of natural gas. Scientific American. https://www.scientificamerican.com/article/methane-leaks-erase-some-of-the-climate-benefits-of-natural-gas/#:~:text=Scientists%20have%20long%20struggled%20to,by%20EPA%2C%20at%201.4%25.
Catherine Mitchell, Jim Sweet, & Tim Jackson. (1990). A study of leakage from the UK natural gas distribution system. Energy Policy, 18(9), 809–818. https://doi.org/10.1016/0301-4215(90)90060-H
Clean Air Task Force. (2023). It happens here too: Methane pollution in Europe`s oil and gas network. Online: https://www.catf.us/resource/it-happens-here-too-methane-pollution-europes-oil-gas-network/
Deborah Gordon, Frances Reuland, Daniel J. Jacob, John R. Worden, Drew Shindell, & Mark Dyson. (2023). Evaluating net life-cycle greenhouse gas emissions intensities from gas and coal at varying methane leakage rates. Environmental Research Letters, 18(8). https://doi.org/10.1088/1748-9326/ace3db
Li, B., Jacob, D. J., Lu Shen, Y., Sulprizio, M. P., Maasakkers, J. D., Varon, D. J., Qu, Z., Chen, Z., Hmiel, B., Parker, R. J., Boesch, H., Wang, H., He, C., & Fan, S. (2023). Observation-derived 2010-2019 trends in methane emissions and intensities from US oil and gas fields tied to activity metrics. Proceedings of the National Academy of Sciences, 120(17). https://doi.org/10.1073/pnas.2217900120
Robert W. Howarth. (2024). The greenhouse gas footprint of liquefied natural gas (LNG) exported from the United States. Energy Science & Engineering, 12(11), 4843–4859. https://doi.org/10.1002/ese3.1934
Sherwin, E. D., Rutherford, J. S., Zhang, Z., et al. (2024). US oil and gas system emissions from nearly one million aerial site measurements. Nature, 627, 328–334. https://doi.org/10.1038/s41586-024-07117-5
Yuanlei Chen, Evan D. Sherwin, Elena S. F. Berman, Brian B. Jones, Matthew P. Gordon, Erin B. Wetherley, Eric A. Kort, & Adam R. Brandt. (2022). Quantifying regional methane emissions in the New Mexico Permian Basin with a comprehensive aerial survey. Energy and Climate, March. https://pubs.acs.org/doi/10.1021/acs.est.1c06458
Yuzhong Zhang, Ritesh Gautam, Sudhanshu Pandey, Mark Omara, Joannes D. Maasakkers, Pankaj Sadavarte, David Lyon, Hannah Nesser, Melissa P. Sulprizio, Daniel J. Varon, Ruixiong Zhang, Sander Houweling, Daniel Zavala-Araiza, Ramon A. Alvarez, Alba Lorente, Steven P. Hamburg, Ilse Aben, & Daniel J. Jacob. (2020). Quantifying methane emissions from the largest oil producing basin in the U.S. from space. Science Advances. https://legacy-assets.eenews.net/open_files/assets/2020/04/23/document_ew_03.pdf